Earth Blox dataset review: Esri 10-Meter Land Cover 2017-2025
The Esri 10m Land Cover dataset provides a consistent annual global view of land cover from 2017–2025 using Sentinel-2 imagery. Iain Woodhouse explores why its stability, accuracy, and global coverage make it a trusted foundation for TNFD, CSRD, EUDR, and long-term land cover change analysis.
The Esri Land Cover product is a 9 year global dataset on a 10m grid derived from Sentinel-2 imagery. Developed through a collaboration between Esri, Impact Observatory, and Microsoft, it uses artificial intelligence to classify the Earth’s surface into nine distinct categories.Unlike near-real-time maps that can be "noisy," this product is designed to provide a more representative annual snapshot. Its credibility and robustness make it a primary tool for those needing to comply with a range of regulatory frameworks and risk assessments.
Earth Blox verdict
This is an essential resource for long-term environmental monitoring and corporate nature-risk reporting. Its greatest strength lies in its temporal stability and its capacity to demonstrably outperform the alternatives in terms of accuracy. While it lacks the more frequent weekly updates of products like Dynamic World, its annual consistency makes it the superior choice for setting defensible baselines for land cover and land cover change.
Pros:
✅ High resolution: The 10m pixel size offers a substantial increase in detail over traditional 30m Landsat products.
✅ Global baseline: Provides a continuous annual record from 2017 to 2025 across all major biomes.
✅ Free and accessible: Distributed under a Creative Commons (CC BY 4.0) licence and integrated into the Earth Blox catalogue.
✅ Validated performance: Independent assessments place its global accuracy at approximately 75%, outperforming several competitors.
Cons:
❌ Annual frequency: Not suitable for detecting rapid, intra-annual changes.
❌ "Built Area" logic: Urban yards and city parks are often classified as "Built Area," masking small-scale urban greenery.
❌ Class ambiguity: It still has challenges in distinguishing between "Rangeland," "Shrub," and "Bare Ground" in complex biomes like the Tundra.
❌ No uncertainty metrics: There is no indication of uncertainty on the classes (unlike Dynamic World)
❌ European detail: In highly fragmented landscapes (like European hedgerows), pixel-based models like ESA WorldCover may resolve more fine-grained detail.
Technical specifications
Ground sample distance: 10 metres (pixel size)
Coverage: Global terrestrial surface
Data Source: Sentinel-2 L2A (Surface Reflectance)
Classification: 9-classes based on a deep learning model (CNN-UNet)
Temporal range: Annual composites from 2017 to 2025
Licence: Creative Commons by Attribution (CC BY 4.0)
Expert review
This dataset was the result of a partnership between Esri, Microsoft, and Impact Observatory, processing more than 5 billion human-labelled pixels as training data for Sentinel-2 scenes to create a global map of land cover.
Historically, such a level of data processing was a task reserved for high-level academic institutions or well-funded agencies, but by leveraging cloud computing (courtesy of Microsoft Planetary Computer) and deep learning, an entire year of planetary data was processed into a consistent map in just a few days.
Methodology and spatial resolution
The product is a thematic map where every 10m pixel is assigned one of nine classes: Water, Trees, Flooded Vegetation, Crops, Built Area, Bare Ground, Snow/Ice, Clouds, and Rangeland.
ESRI LULC utilises a UNet model that incorporates multiple observations throughout the year. The model did not utilise the temporal characteristics of the LC types, which might ultimately reduce its effectiveness, especially in some land cover classes where the temporal signature is a strong indicator of the class.
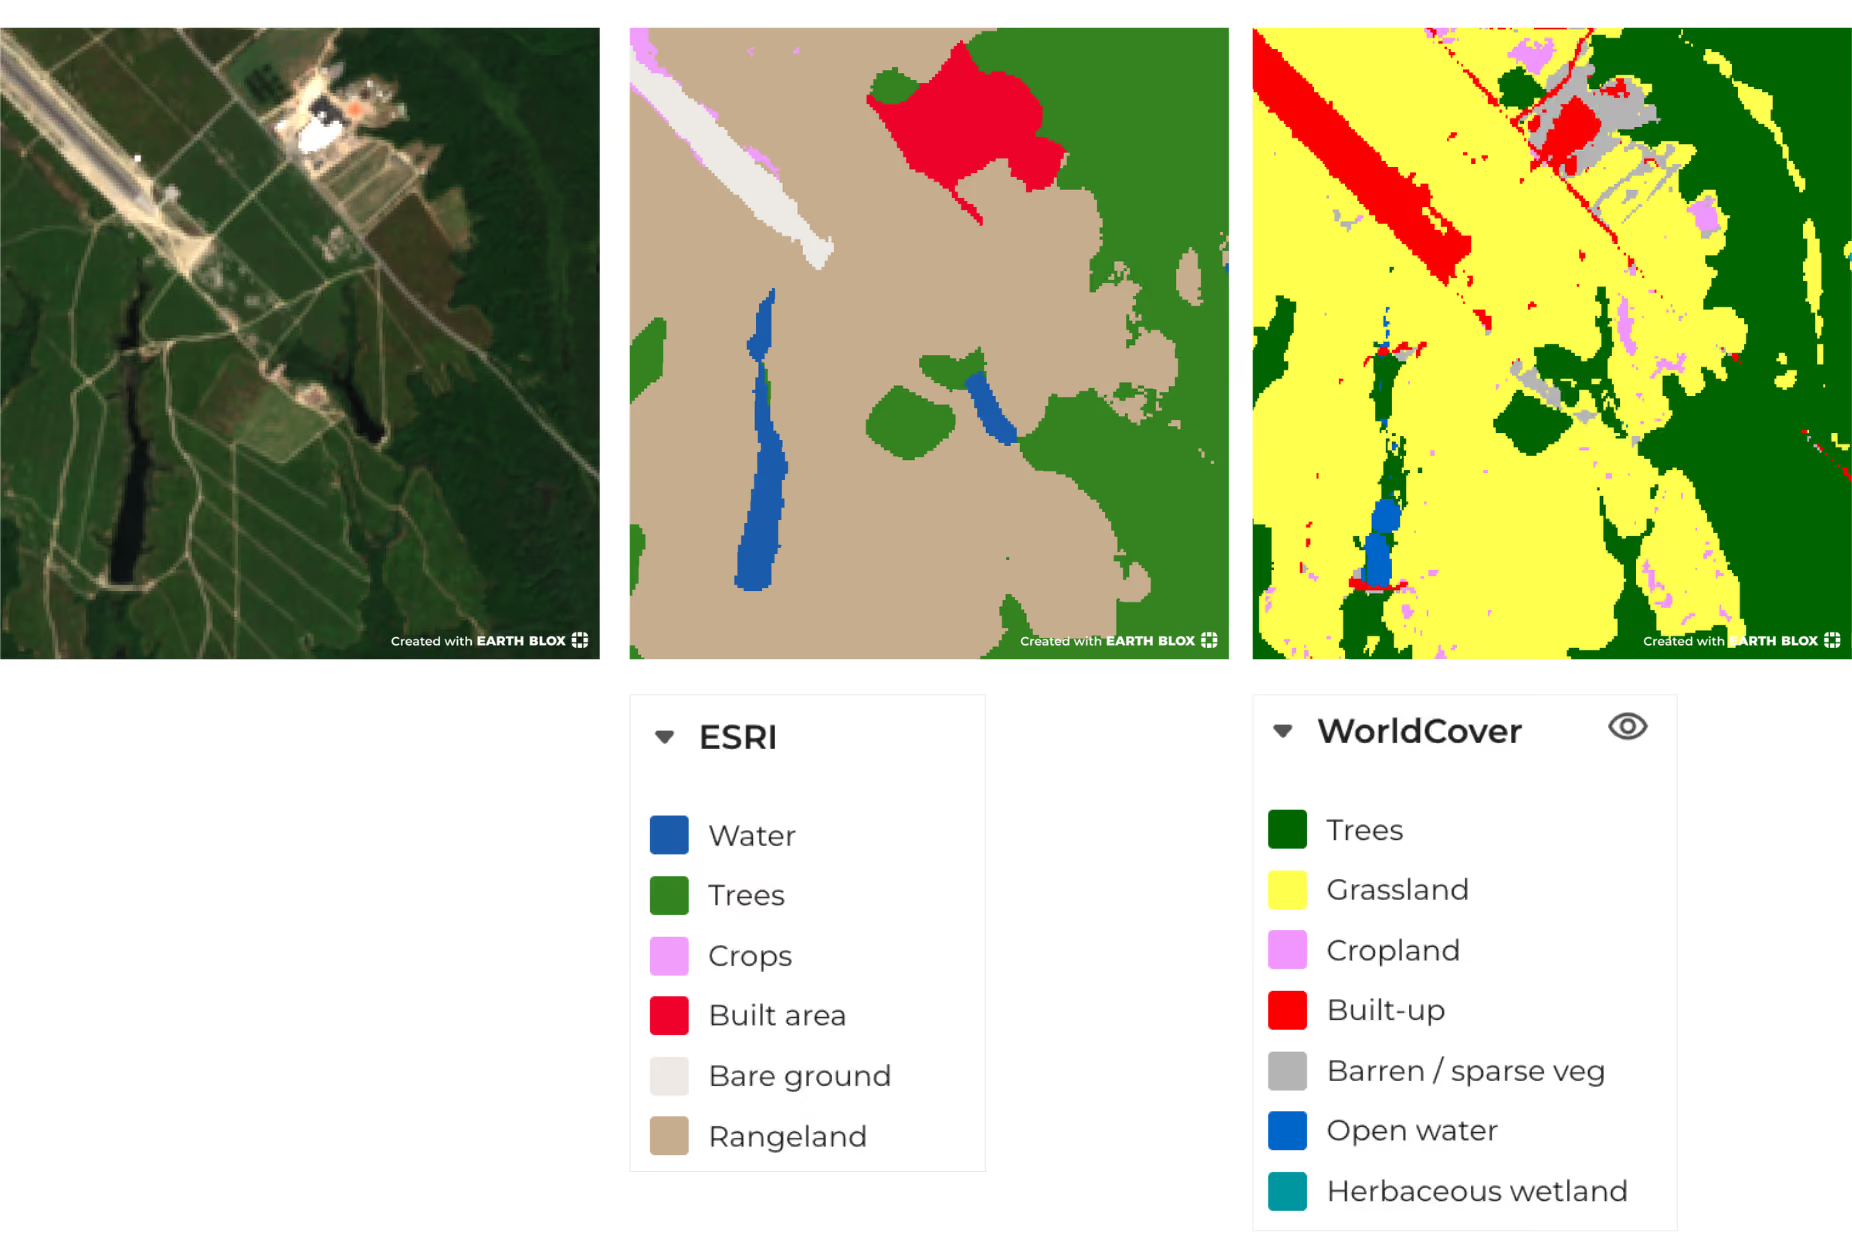
The minimum mapping unit (MMU) of the training data was a dataset annotated in 50 × 50 m units, which ultimately impacts the spatial resolution of the final map product. Note that even though the product is on a 10m grid, that does not guarantee 10m spatial resolution across the entire dataset. You should not expect to see details in the classification output on as fine a scale as you can see in the Sentinel 2 data used as input. To illustrate this, take a look at the following three images: The first is the original Sentinel data (cloud masked and averaged over several months); the second is the ESRI land cover map; the third is the ESA WorldCover land cover map, also on a 10m grid.
A comparison of Sentinel 2, ESRI and ESA WorldCover in order to illustrate the lower resolution of ESRI, despite having the same 10m pixel size as WorldCover. The first image is the original Sentinel 2 data (cloud masked and averaged over several months); the second is the ESRI land cover map; the third is the ESA WorldCover land cover map. All three images have a pixel size of 10m.
The ESRI landcover map is robust and repeatable, but it doesn’t give you as detailed a map as the 10m pixel size might suggest. This is part of the trade-off to ensure that the “change” over time is more consistent and not unduly impacted by individual pixels switching too easily between land cover classes.
How does the data perform?
In terms of scientific rigour, the Esri product is well-regarded for global applications. Several studies have shown it outperforms other similar products across many (but not all) conditions and geographies.
It maintains a global balanced accuracy of approximately 75%, with particularly high scores for Water (92%), Built Area (83%), and Trees (81%).
However, its performance varies by geographic region. While it excels in North America and across temperate forests, it can struggle in Africa or the Tundra, where the spectral signatures of sparse vegetation and bare soil overlap. In Europe, research suggests that ESA WorldCover — which additionally incorporates Sentinel 1 radar data — is slightly more accurate and exhibits a higher spatial resolution, resolving features at a scale closer to the Sentinel 2 input imagery (as shown above).
It is important to note that this dataset applies a particular logic for the "Built Area" class. The model prioritises "land use" over "land cover" in urban settings. This means that suburban gardens or small groves of trees within a city are often labelled as "Built Area" to reflect the human footprint. If your focus is assessing "nature-positive" urban investments, this is a crucial distinction to keep in mind.
An important consideration for all global landcover datasets is that each tends to perform differently across different geographies. One dataset might work best in lowland areas, whereas another works best in upland and mountainous regions.
For more background on how it performs compared to other products, take a look at these papers:
This dataset is tailor-made for nature reporting. Under the TNFD LEAP framework, companies must "Locate" their interface with nature and "Evaluate" their impacts. The annual time series allows users to overlay their asset locations against this map to see if their value chain is driving land-use change.
For those managing the EU Deforestation Regulation (EUDR) or CSRD reporting, having a defensible, multi-year record of tree cover change at a 10m scale provides the evidence needed for audit-ready disclosures.
The Earth Blox team are also using it to quantify indicators of landscape connectivity, a CSRD reporting metric.
Suggested alternatives
ESA WorldCover (10m)
An annual global map that also incorporates Sentinel-1 radar data. It is often better at resolving small-scale features in complex, cloudy landscapes such as those in the UK and across Europe. If you need higher spatial resolution that gets closer to the 10m input from Sentinel 2, then use WorldCover.
Google Dynamic World (10m)
If you need something closer to "near-real-time" data, this is the one. It updates almost weekly as new imagery arrives. However, it is much noisier than the Esri annual product and better suited for detecting rapid disturbances that require more detailed examination, rather than long-term reporting.
Iain is a Professor of Applied Earth Observation at Edinburgh University, specialising in active remote sensing. He has over 27 years experience in academia and industry, 100+ publications, and advises UK government agencies on EO strategy.




.avif)