Earth Blox dataset review: The Biodiversity Intactness Index (BII)
The Biodiversity Intactness Index (BII) offers a 100m-resolution view of ecosystem health, helping organisations assess biodiversity integrity for TNFD, CSRD, and supply chain risk analysis. Iain Woodhouse explores why this dataset is becoming essential for nature-related risk and compliance workflows.
Biodiversity is now centre stage of strategic and operational risk management. For businesses navigating the Taskforce on Nature-related Financial Disclosures (TNFD) and the Corporate Sustainability Reporting Directive (CSRD), the Biodiversity Intactness Index (BII) provides a rigorous, scalable measure of ecosystem health. It estimates how much of a region’s natural biodiversity remains compared to its original state, expressed as a percentage.
The 100-metre gridded BII from Vizzuality and Impact Observatory available on Earth Blox is now an essential tool for asset-level reporting and site-specific screening.
An example BII map on Earth Blox showing an area in Northern India. Darker green areas represent areas closer to their original ecosystem.
Earth Blox verdict
The BII is a foundational dataset for reporting on the state of nature. Its strength lies in condensing complex ecological data into a single 0–100% score that is comparable across different biomes. Grounded in the Natural History Museum’s PREDICTS database, containing millions of ground-level observations on ~58,000 species, it offers a level of depth that purely satellite-derived indices cannot match.
It is important to remember that the BII is a modelled projection, not a real-time measurement. While the 100-metre version is a breakthrough in providing a high level of detail, it is still just a statistical estimate based on human pressure proxies. Even still, it remains an excellent tool for high-level site screening and risk prioritisation across operations, and for identifying "sensitive locations." Just be sure to pair it with site-specific data for project-level interventions.
Pros:
✅ High scientific credibility: Using a method developed by the Natural History Museum based on the peer-reviewed PREDICTS database with over 3.25 million observations across more than 47,000 species.
✅ Global standardisation: The 0–100% scale enables fair comparisons across geographic regions, essential for global site and supply chain assessments.
✅ Regulatory alignment: Directly supports the "Condition" and "Integrity" requirements of TNFD and CSRD (ESRS E4).
✅ Asset-level detail: The 100-metre resolution allows users to map specific asset locations against local ecosystem health.
Cons:
❌ Modelled uncertainty: Accuracy may be lower in regions where the ground-level ecological data is sparse.
❌ Temporal lag: Robust versions often rely on historical land-use data, which can result in a multi-year lag.
❌ Terrestrial only: Does not yet account for marine or freshwater aquatic ecosystems.
Unit of measurement: 0 to 1 (0% to 100%), where 1.0 is a pristine ecosystem
Data sources: Land cover (from Sentinel-2), population density, and nighttime lights
Licensing: Creative Commons Attribution 4.0 International (CC BY 4.0)
Expert review
Unlike simple "species richness" metrics, which can be boosted by invasive non-native species, the BII represents the average abundance of native species relative to a pristine reference state. A score of 100% indicates that the natural ecosystem is still fully intact (at the time of the map generation), while a score below 90% suggests the landscape may no longer reliably provide the critical ecosystem services required, such as pollination or water regulation.
The Biodiversity Intactness Index (BII) is calculated by a straightforward combination of two primary metrics: Abundance (the total quantity of individuals) and Compositional Similarity (how closely the species composition of an area matches that of an intact ecological baseline). To estimate these metrics, a linear mixed-effects model is fitted using observations from the PREDICTS database alongside independent spatial datasets that track human pressures. Maps predicting Abundance and Compositional Similarity are then generated separately and normalised to a 0-to-1 scale by dividing the map values by a modelled "no human influence" baseline. Finally, the overall BII is computed for 2017-2020 by multiplying the normalised Abundance value by the normalised Compositional Similarity value.
The 100m resolution leap
Previously, global biodiversity maps were typically provided at scales of many kilometres, which is too coarse for assessing specific assets such as mines or farms. The 100-metre BII projections, on the other hand, utilise annual Sentinel-2 land-use data to see "edge effects", and reveal the detail of the degradation occurring at the boundaries of human activity. For Earth Blox users, this quality of detailed data allows it to be used in the "Locate" and "Evaluate" phases of the TNFD LEAP approach at the asset level.
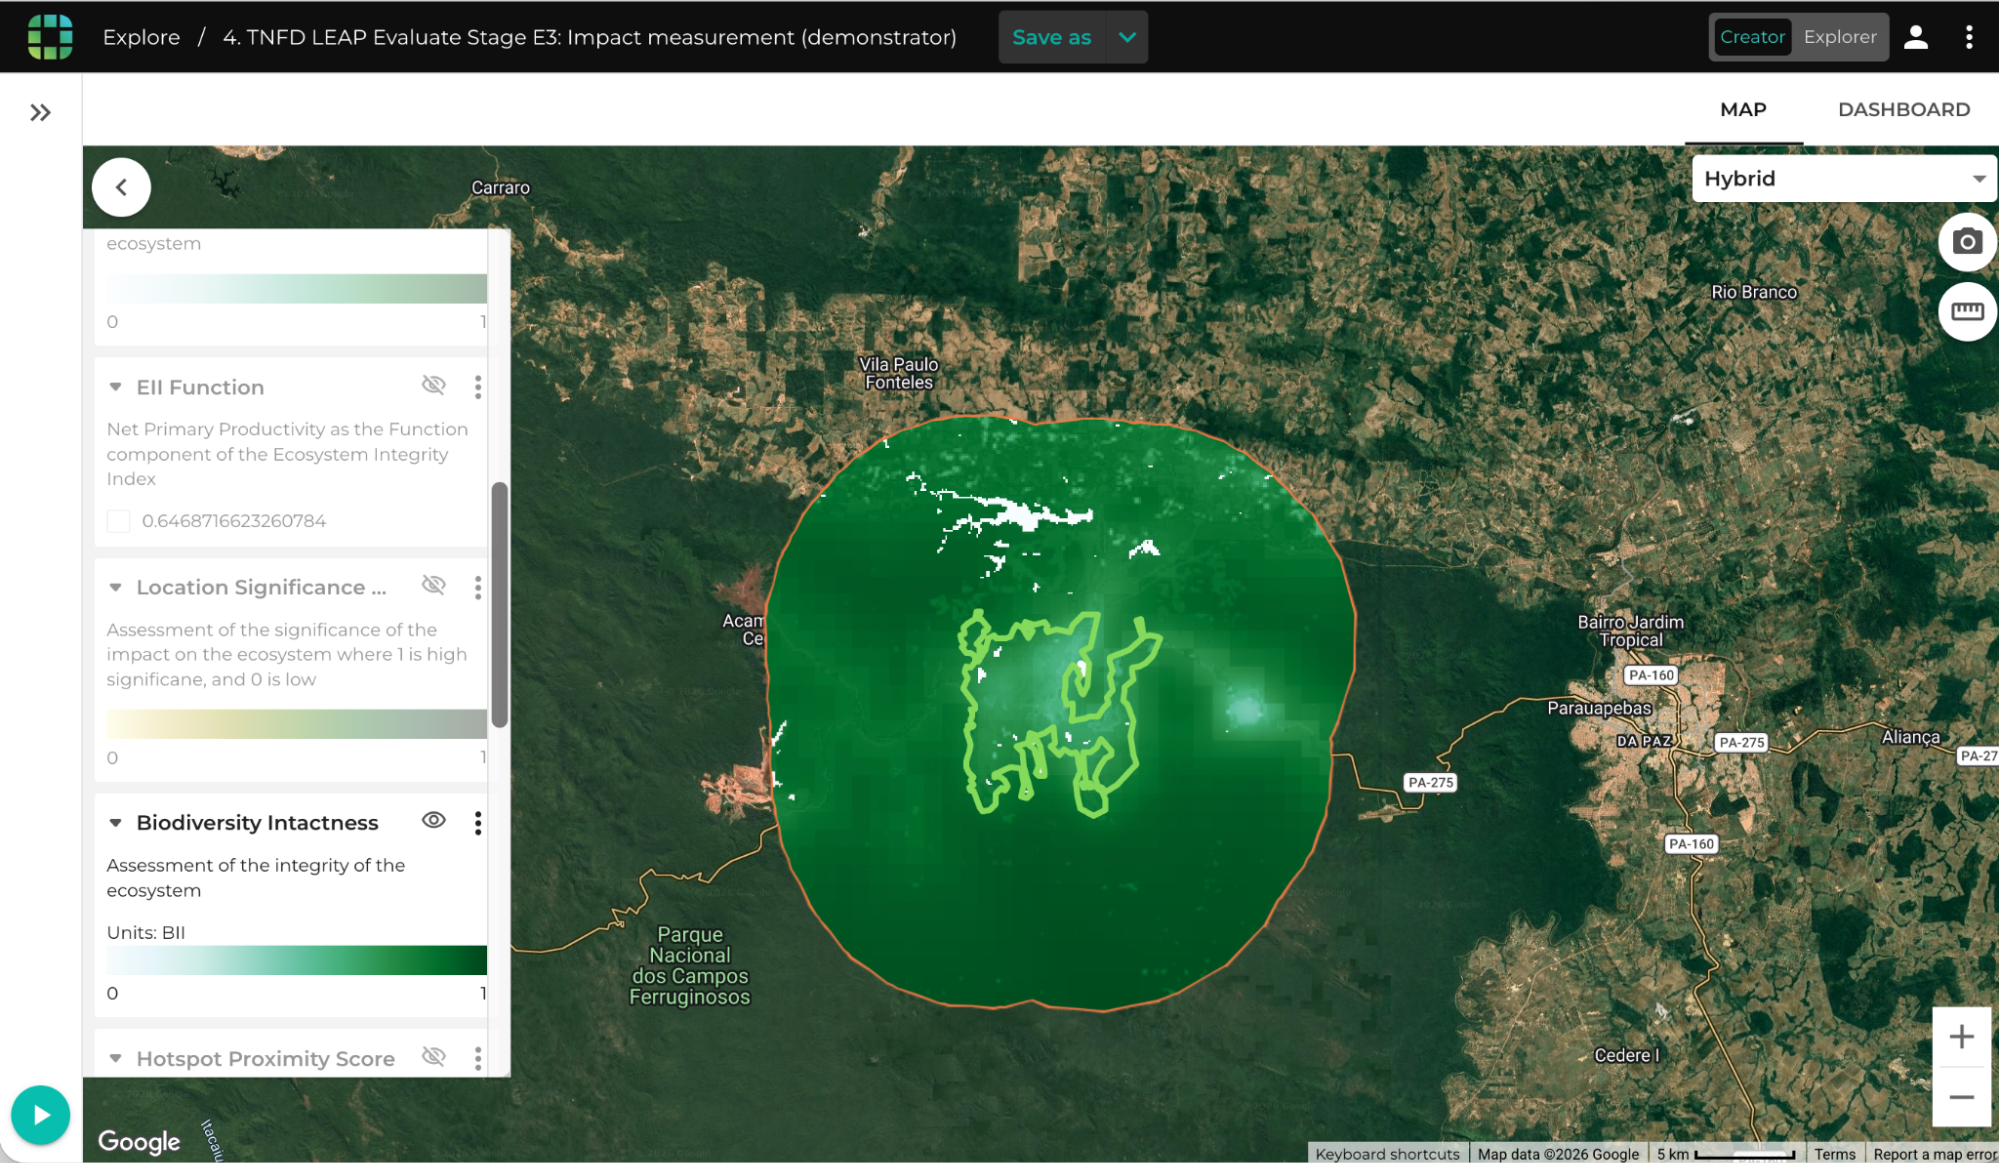
An example BII map showing on Earth Blox the intactness surrounding a mining area in Brazil (the final footprint of the mine is outlined in light green). This example is from a TNFD LEAP Evaluation, that supports TNFD Stage E3: “Impact measurement”. Darker green areas represent areas closer to their original ecosystem, whereas lighter green areas have been impacted. The data clearly shows that the mine and surrounding infrastructure have impacted the biodiversity intactness (note that the mine was not yet fully operational at the time this BII layer was calculated).
Corporate and sector use cases
1. TNFD and CSRD compliance
As well as supporting the TNFD’s Core Global Disclosure Metrics for Dependency and Impact, the BII is also a key parameter in determining the "double materiality" assessments required under the CSRD.
Impact materiality: A declining BII score identifies a company's negative impact on nature.
Financial materiality: If a supply chain is located where BII falls below 90%, the risk of ecosystem service failure becomes a material financial threat.
2. EUDR and supply chain due diligence
The EU Deforestation Regulation (EUDR) requires products to be "deforestation-free". The BII provide an extra layer of due diligence beyond simple tree cover. A plantation might have trees but a low BII score, indicating it is ecologically fragile and at risk of future regulatory intervention or production volatility.
Performance and limitations
As a modelled product, the BII automatically assumes that similar land-use pressures result in similar biodiversity outcomes. As a consequence, it may miss highly localised restoration successes or be less sensitive to "invisible" drivers like pesticide use. However, for high-level risk management, it is currently the standard metric for quantifying ecosystem integrity.
Similar products and suggested alternatives
There are five other data products available on Earth Blox that provide some information on ecosystems and their intactness.
The Mean Species Abundance (MSA) is conceptually similar to the BII and measures the average abundance of original species relative to an undisturbed baseline.
Since the BII is a component of the Ecosystem Integrity Index (EII), it might be argued that this is sufficient, and using the BII on its own is not required. EEI is a broader, composite index that synthesises three pillars of ecosystem health: compositional integrity (powered by the BII), functional integrity (satellite-derived vegetation productivity), and structural integrity (habitat connectivity and human modification).
The Species Threat Abatement and Restoration (STAR) Metric quantifies the potential contribution of site-level conservation or restoration actions to reducing global species extinction risks, rather than assessing overall ecosystem condition.
If you are specifically interested in forest-related metrics, the Forest LandscapeIntegrity Index (FLII) might be a suitable alternative. This is a continuous measure of forest condition by integrating data on forest extent, observed human pressures, and structural connectivity.
A highly regarded commercially available dataset is the Integrated Biodiversity Assessment Tool (IBAT). This provides direct spatial data on globally recognised priority areas, including statutory Protected Areas, Key Biodiversity Areas (KBAs), and threatened species ranges. Contact us for more information on accessing this dataset through Earth Blox.
Conclusion
The Biodiversity Intactness Index is an essential tool for building organisational resilience when it comes to nature risk. By providing a 100m-gridded view of nature's health, it enables Earth Blox users to operationalise the TNFD, comply with the CSRD, and conduct the necessary due diligence on global supply chains.
Iain is a Professor of Applied Earth Observation at Edinburgh University, specialising in active remote sensing. He has over 27 years experience in academia and industry, 100+ publications, and advises UK government agencies on EO strategy.


.png)