Earth Blox dataset review: Global Human Modification (GHM)
The Global Human Modification (GHM) dataset provides a globally consistent measure of cumulative human pressure, helping organisations identify ecosystem integrity risks for TNFD, CSRD, and nature-positive decision-making. Iain Woodhouse explores why GHM is becoming a critical baseline for nature risk and environmental reporting.
Nature risk is now on the boardroom agenda. As the Taskforce on Nature-related Financial Disclosures (TNFD) and the Corporate Sustainability Reporting Directive (CSRD) shape corporate reporting, organisations need rigorous data to quantify human impact more than ever. The Global Human Modification (GHM) dataset is a critical tool to tackle this, synthesising cumulative pressures, such as road density and agricultural intensity, into a single, continuous gradient of landscape integrity. By moving beyond simple land-cover maps, the GHM provides a baseline for assessing ecosystem resilience across global portfolios and operational assets.
Earth Blox verdict
GHM is currently the definitive dataset for mapping the "industrial footprint" of human activity. Its primary value is its ability to capture overlapping stressors; for example, fragmentation from powerlines occurring alongside industrial expansion. This makes it ideal for the "Locate" and "Evaluate" phases of the TNFD LEAP approach. While it may miss very low-intensity modifications, it is scientifically robust enough to be an essential ingredient for nature-risk dashboards.
Pros
✅ Breadth of stressors: Includes up to 16 distinct anthropogenic pressures, from wind turbines to livestock.
✅ Continuous scale: The 0–1 score makes it easy to work with while identifying subtle degradation before total habitat loss.
✅ Fuzzy sum logic: Avoids over-counting where multiple pressures (e.g., road and rail) coexist.
✅ Regulatory alignment: Supports TNFD metrics and feeds into the Ecosystem Integrity Index (EII).
Cons
❌ Detection gaps: May miss low-intensity impacts like selective logging or under-canopy grazing.
❌ Data latency: Change-consistent time series typically lags real-time conditions by several years.
❌ High-latitude bias: May overestimate modification in remote polar regions.
❌ Granularity limits: Struggles to differentiate high-density urban types without pairing with higher-res data.
Technical specs
Ground sample distance: 300m (time-series) and 90m (static snapshot)
Temporal coverage: 1990 to 2020 (v3 includes 5-year intervals) + a 2022 static snapshot (not for comparison to time-series)
Metric scale: 0.0 (unmodified) to 1.0 (maximum modification)
Licensing: Creative Commons Attribution 4.0 International (CC BY 4.0)
Expert review
Previous human impact measures have made a binary distinction about the landscape between “wild” or “untouched” and “modified” or “converted”. The GHM was developed to provide a more nuanced look at human modification and recognise that there are subtle variations between these two extremes. Developed by researchers at Colorado State University and The Nature Conservancy, it models the spatial extent and intensity of human activities to reflect a more graded reality, highlighting that, in fact, 95% of the Earth's surface shows some human modification.
The latest version (V3) aggregates threats into eight IUCN-aligned categories, including Built-Up areas (BU), Agriculture (AG), Energy & Mining (EX), and Transportation (TI). This allows analysts to identify the specific drivers of risk. Mathematically, GHM uses a "Fuzzy Algebraic Sum" to ensure cumulative impacts converge towards 1.0 without exceeding it, accurately reflecting the saturating nature of human impact.
How is GHM calculated?
The GHM methodology is designed to reflect the complex reality of landscape pressure by avoiding simple additive logic. It is calculated through a three-step process:
Stressor footprint: For each specific human pressure (e.g., a mine or a road), the model first determines its spatial extent (He) — the proportion of the pixel area physically occupied by that activity.
Intensity weighting: This footprint is multiplied by an intensity value (Hi), ranging from 0 to 1. These weights are often based on Landscape Development Intensity (LDI), a metric that captures the per-unit amount of non-renewable energy required to maintain a human activity.
Probability weighting: Hp is the probability that a stressor occurs at a location to account for spatial and classification uncertainty.
Fuzzy sum aggregation: To combine multiple stressors (e.g., where a powerline runs through a commercial zone), the model applies a Fuzzy Algebraic Sum (also known as an "increasive mean").
The final cumulative GHM (HMc) is calculated as:
where HMs is the modification score (He x Hp x Hi) for each individual stressor, s.
This mathematical approach is vital for corporate risk assessment because it accounts for the non-independence of threats – roads and infrastructure are never uncorrelated, for example. So this approach ensures that as more stressors are added, the total modification value converges towards 1.0 but never exceeds it, accurately reflecting how a landscape becomes "saturated" by human impact.
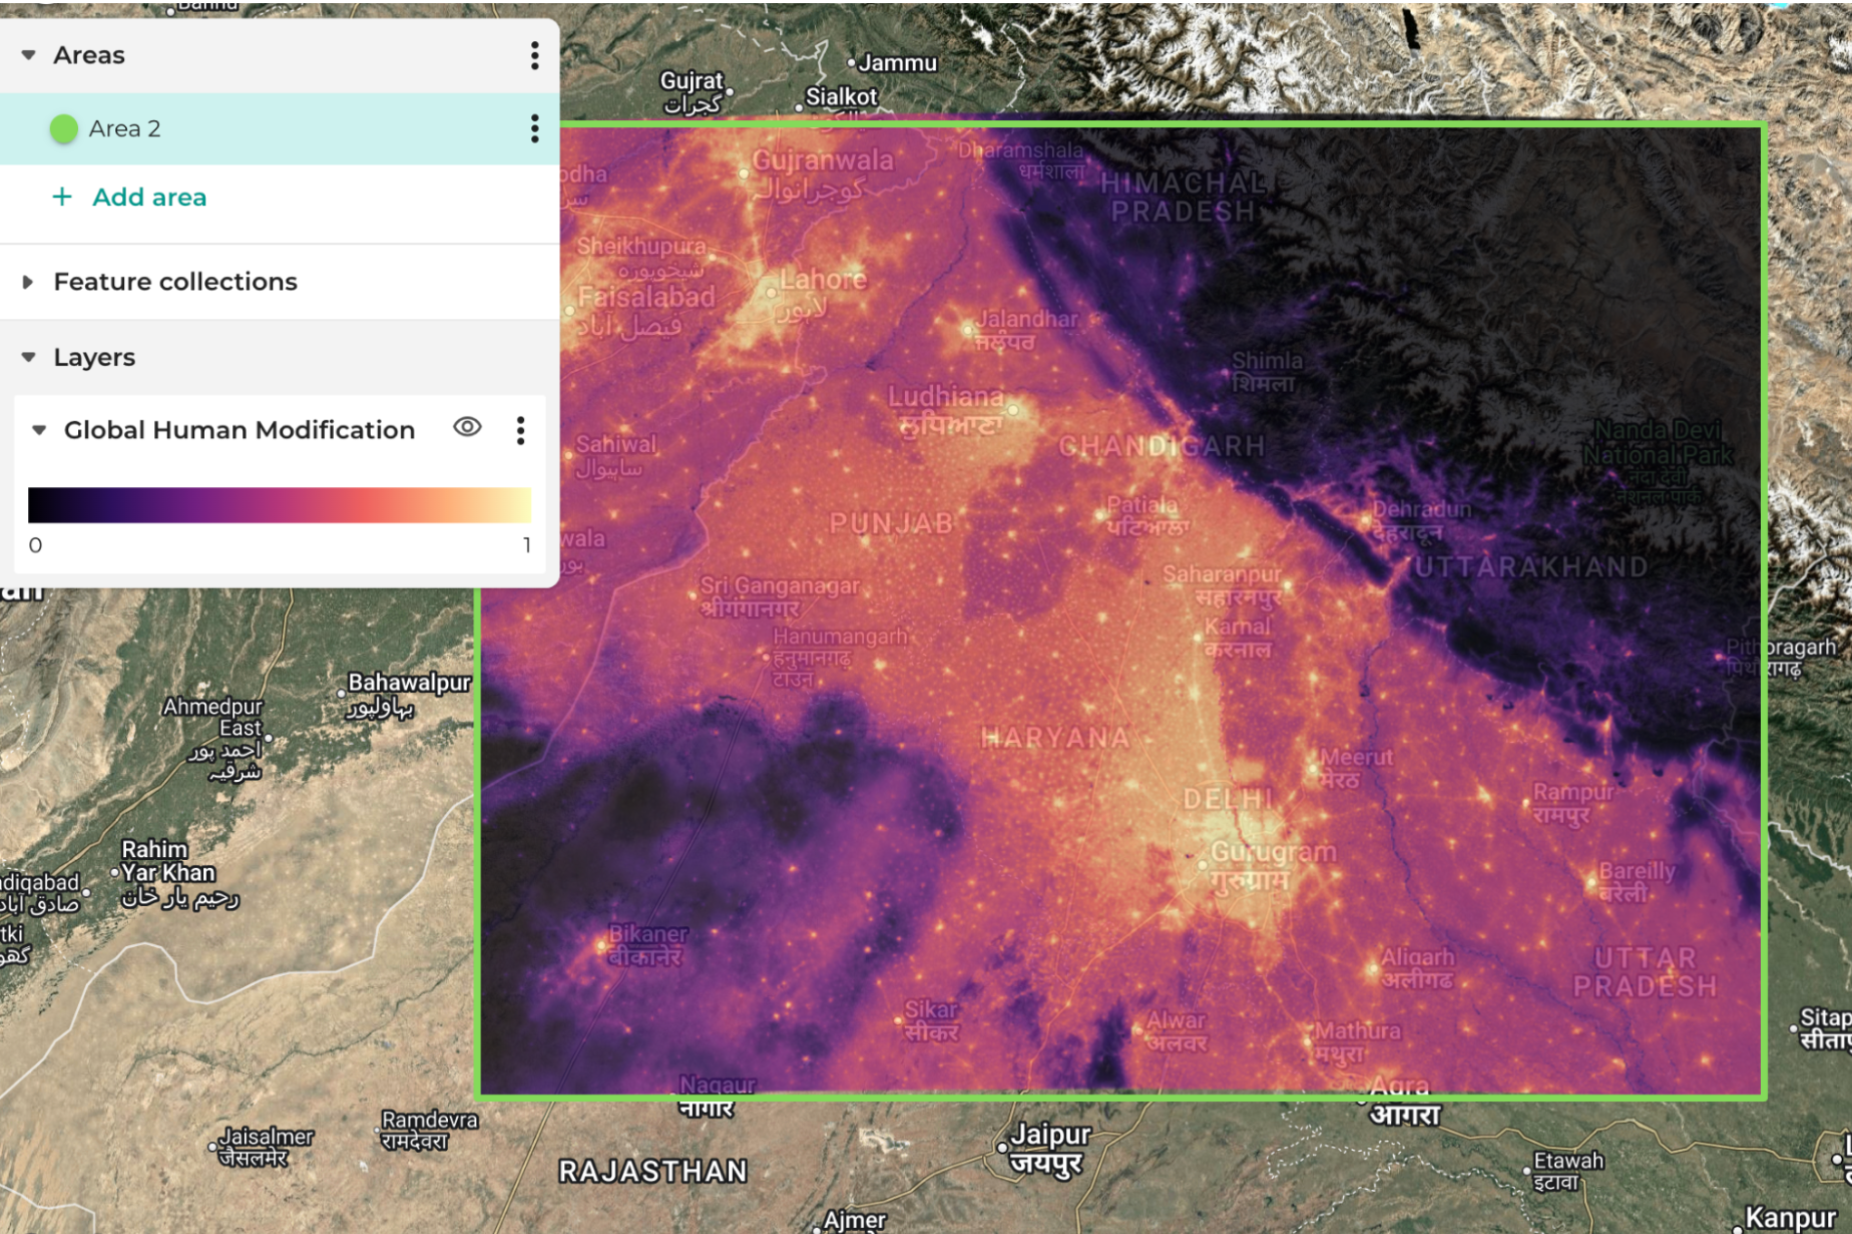
An example output from the Global Human Modification index layer over northern India on Earth Blox. The darker colours represent lower human modification. Delhi is the bright area in the lower middle, demonstrating maximum modification, while the black areas towards the top right are the untouched Himalayas.
GHM and Ecosystem Integrity
The GHM is also important because it forms one of the three foundational inputs ("Structural Integrity") for the UNEP-WCMC’s Ecosystem Integrity Index (EII). In this framework, structural integrity represents habitat intactness and the degree of fragmentation, which in turn is paired with compositional and functional data. A key insight for organisations managing physical assets is the EII's use of neighbourhood analysis, which recognises that an asset's risk is dependent on the integrity of the surrounding landscape, not just the site itself.
Corporate and sector use cases
1. TNFD LEAP: The "Locate" Phase
GHM provides a globally consistent way to identify "High Integrity" ecosystems. Businesses can screen real estate, project portfolios and operational footprints to identify assets encroaching on natural areas (GHM < 0.10), where future regulatory protections create transition risks.
2. CSRD/ESRS E4: Double Materiality
Within the CSRD framework, GHM offers a "state of nature" baseline for Impact Materiality. High GHM values indicate heavy modification, which may increase a company's reliance on artificial ecosystem substitutes. Furthermore, high GHM is strongly correlated with physical risks like increased Land Surface Temperature (LST) (the Urban Heat Island effect), which can impact operational costs (such as cooling).
While other datasets track historical forest loss, GHM tracks the potential for future loss. Low GHM areas experiencing increases in transportation (TI) or accessibility (HA) stressors are high-risk hotspots for imminent deforestation, potentially serving as an early warning system for commodity sourcing and supply chains.
Similar products and suggested alternatives
The Ecosystem Integrity Index (EII) is used in State of Nature reporting and uses the GHM as one of its input layers. As such, it does contain the information embedded in the GHM, but since the combination of input parameters to the EII is non-linear, you do not have a one–to-one correspondence between the EII and GHM.
The Terrestrial Human Footprint Map from the Wildlife Conservation Society has a similar ambition to the GHM, in that it aims to monitor annual changes in anthropogenic pressures on nature. The THF is based on land cover change, population density, nighttime lights, roads, railways, and navigable rivers, and has a grid spacing of 100m. However, this only covers 2017-21 and has fewer scientific publications to support it than the GHM.
Google’s Dynamic Worldlandcover classification has an “urban” class, so this dataset can be used to track key human impacts with weekly updates. While in many parts of the world, cloud cover hinders weekly coverage, a monthly cadence greatly increases the chance of cloud-free data. And with 10m resolution, it offers a degree of spatial and temporal granularity that is vital for many projects.
Conclusion: Managing the middle ground
The GHM offers a "reality check" for complex environmental claims. For operations and sustainability managers, the most critical insights are gained in the "middle ground": moderately modified landscapes where restoration efforts often yield the highest "nature-positive" returns and hidden transition risks are most likely to appear. Whether used for asset screening or verifying the integrity of carbon projects, GHM is an essential tool for evidence-led sustainability reporting.
Iain is a Professor of Applied Earth Observation at Edinburgh University, specialising in active remote sensing. He has over 27 years experience in academia and industry, 100+ publications, and advises UK government agencies on EO strategy.