Earth Blox dataset review: Hansen Global Forest Change
The Hansen Global Forest Change dataset offers a 30m, globally consistent record of forest change from 2000 to 2024. Iain Woodhouse explores how it became the definitive baseline for tracking deforestation and estimating forest carbon loss.
For those of us tracking the state of the world's forests, the Hansen Global Forest Change (GFC) dataset is more than just a map; it's the definitive reference point for more than two decades of forest change. Since its original publication in Science in 2013, this product has fundamentally changed how we systematically monitor deforestation and track global carbon dynamics. By leveraging the continuous archive of Landsat satellite data, the GFC provides a globally consistent, high-resolution view of forest change over the past quarter-century.
Earth Blox verdict
The Hansen GFC dataset is the essential global baseline for quantifying forest change. Its 30-meter resolution and two-decade-long, consistently processed time series (2000 to 2024) offer unparalleled fidelity at the global scale. It is a powerful, free, and robust dataset. The one caveat is that you must use it as intended and with due care and attention to local conditions.
Pros:
✅ Exceptional temporal depth: Provides a globally consistent record of forest change annually from 2000 to 2024, which is vital for long-term baselines.
✅ Global, high-resolution and consistent: Offers 30-meter resolution globally, a remarkable level of detail for a dataset covering the entire planet.
✅ Open and accessible: The data is free and open-access (CC-BY-4.0).
✅ Foundational to policy: It is frequently used to benchmark national monitoring systems (like those for REDD+) and is a key input for major forest monitoring platforms such as Global Forest Watch.
✅ Quantifies forest extent: Includes the treecover2000 layer, which gives the initial percentage of canopy cover for the year 2000, allowing users to define their own forest threshold.
Cons:
❌ Gain data is stale: The gain product, which tracks reforestation, was last updated in 2012, meaning it misses the last 12 years of new forest establishment. Problematic if you want to look at net gains vs losses.
❌ Loss ≠ deforestation: The 'forest loss' metric simply identifies a change from forest to non-forest. It does not distinguish between natural forest conversion, fire, or the harvesting of commercial tree plantations.
❌ Requires calibration: Since the dataset defines trees as vegetation taller than 5m, users must apply a canopy cover threshold (e.g., 30% or 50%) to the treecover2000 layer to generate a binary "forest" mask that aligns with national standards.
❌ Global consistency means local inconsistencies: Like all global maps, it can have a good global performance but may perform poorly in any specific location.
Technical specs
Ground sample distance (pixel size): 31 metres.
Coverage: Global terrestrial surface.
Data source: Landsat 7, 8, and 9 time series.
Time period: 2000 to 2024.
Expert review
What is the data?
The Hansen Global Forest Change dataset is generated by performing a time-series analysis of available cloud-free Landsat satellite images (30-meter resolution) collected globally from 2000 to the present. For each pixel, a supervised machine learning algorithm (trained on high-resolution imagery and existing tree cover layers) analyses the change in spectral signature over time to produce three core metrics: Tree Cover in 2000 (as a percentage of canopy cover for vegetation (>5m in height), the Year of Loss (indicating a change from forest to non-forest), and Forest Gain (a shift from non-forest to forest, although note that this metric has not been updated since 2012). The result is an annually updated, globally consistent map of forest cover and forest loss.
It is a measure of this data set’s significance that when evaluating other forest change products, the GFC is the standard comparator when assessing other forest change products. This prominence is due not necessarily to its being the superior product, but because it is the most heavily examined and publicly critiqued open dataset available.
What is 'forest' in GFC?
An important feature of this dataset is that it gives you the building blocks to define the original forest layer yourself. The core metric is the treecover2000 layer, which is the percentage of tree canopy cover (for vegetation taller than 5m) within the 30m pixel.
This means the data is not a pre-classified forest map per se, but a forest cover map that allows the user to set the boundary as defined by local definitions of a forest. The 5m height is consistent with the UN Food and Agriculture Organisation’s (FAO) definition of a tree, but the FAO uses a 10% canopy cover threshold, while many countries use 30% or 50%. When using this data in Earth Blox, we recommend applying a threshold mask that matches your project requirements or national reporting standards. For instance, studies have shown that in dense forests like Guyana, a much higher threshold (e.g., 94%) might be needed to accurately align with local data. All subsequent data will then reflect changes to this 2000 baseline.
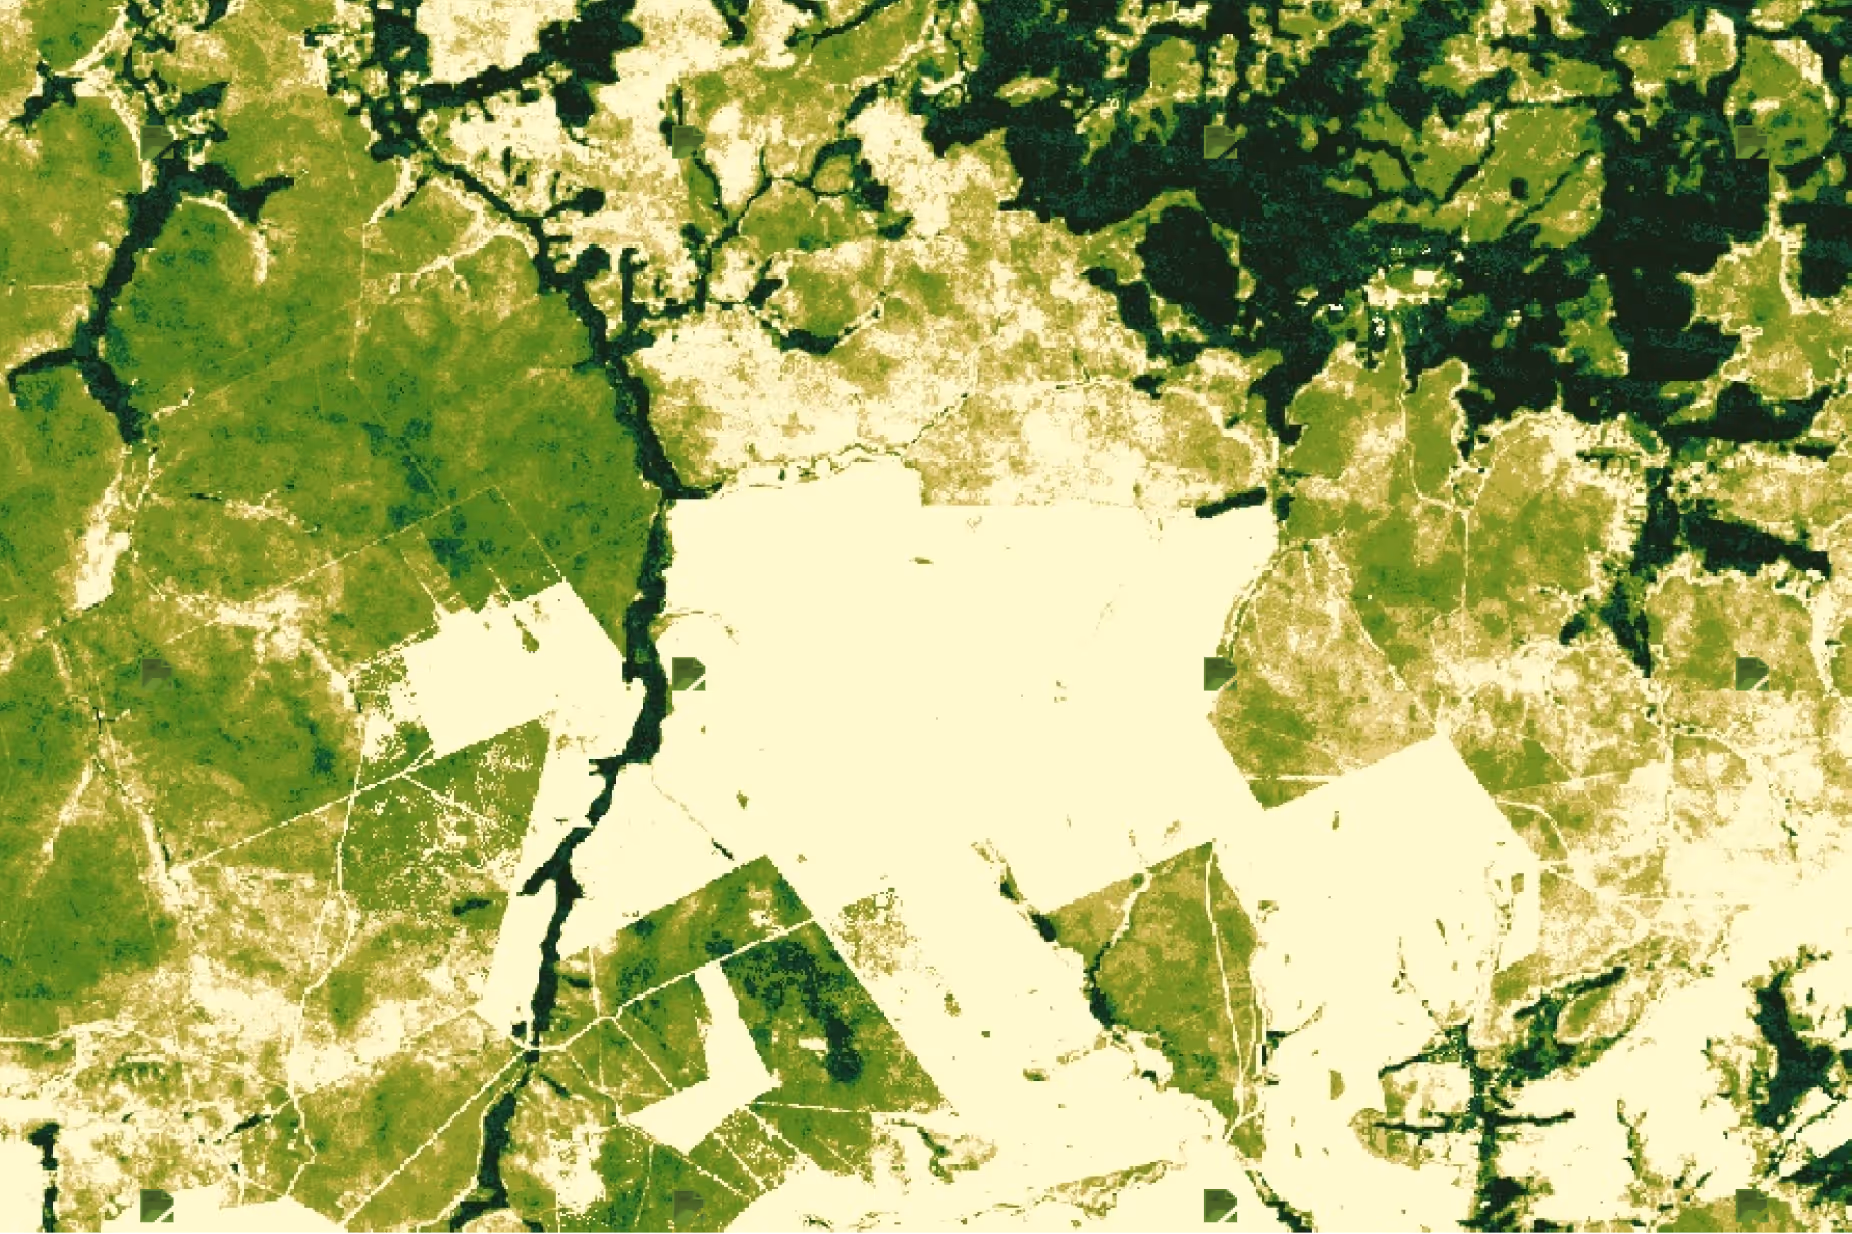
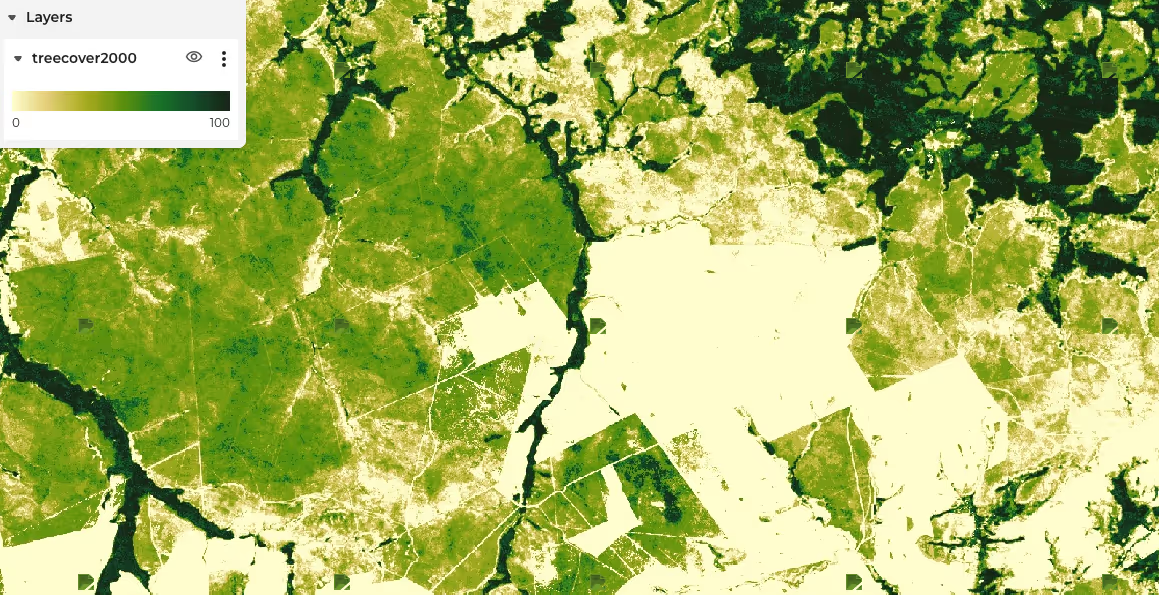
An example map in the Brazilian Cerrado showing the treecover2000 product. Note how the scale of the data ranges from 0 to 100%.
Note: 'Loss' does not equal 'deforestation'.
Strictly speaking, 'deforestation' is a political or legal term defined by the IPCC as the conversion of forest land use to non-forest land use. 'Loss' in the Hansen data is a purely biophysical event: a disturbance leading to forest loss. This means that the felling of a tree plantation for harvest is considered no different to the clear-cutting of primary tropical forest for conversion to pasture. In terms of land use, these two things are different. In terms of land cover, they are the same.
This is arguably a strength for scientists seeking unbiased land cover change data, but it is a limitation for compliance-driven users who need to exclude managed forestry. For instance, in areas with extensive plantation forestry (like the southeastern US or Eastern Brazil), the GFC can register massive losses that are simply commercial harvesting and subsequent regrowth.
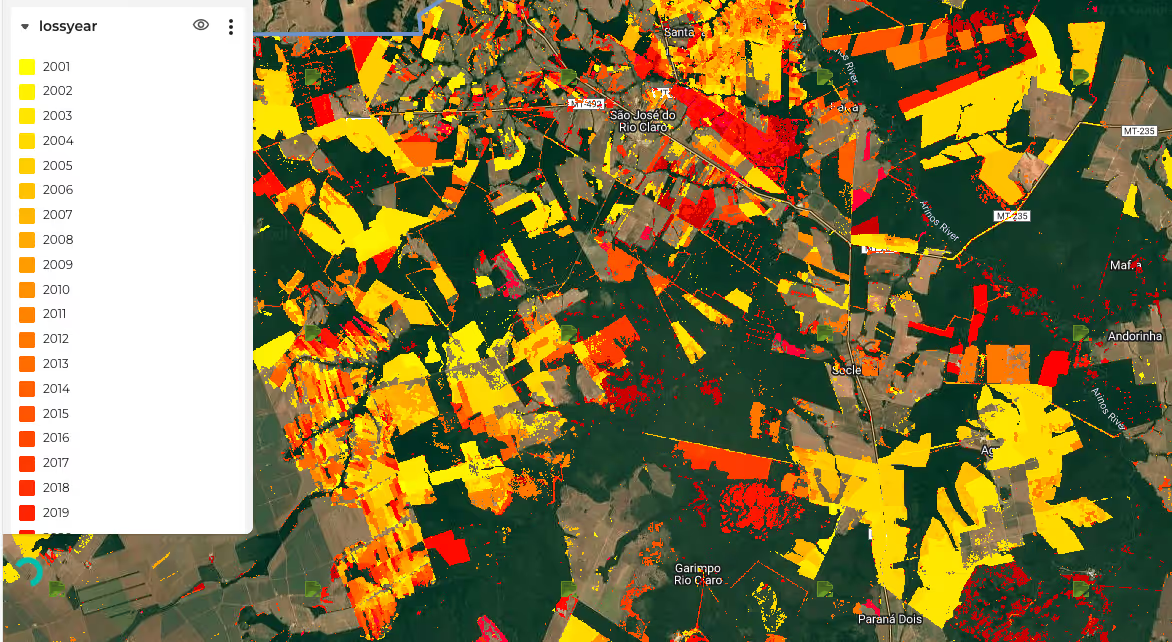
A core output from this dataset is the “loss year”. This example shows forest loss in an area of Brazil, where each colour represents the year that the forest was lost.
Estimating forest carbon loss
A first estimate of forest carbon loss can be done by overlaying the Hansen forest loss product with forest biomass maps that pre-date the forest loss. In Earth Blox, this can be done in conjunction with a dedicated biomass maps, such as the ESA above-ground carbon map series, or from static products, such as NASA’s Biomass Carbon Density map (2010) or the Earth Blox GEDI Global Biomass map (2020), to understand the carbon implications of the observed change. If you are looking at initialising carbon projects or benchmarking national reporting data, this approach is a quick and effective way to set the boundary conditions. For more accurate carbon estimates, we recommend the use of Chloris forest carbon data or the Planet’s Diligence product, both of which are available via the Earth Blox platform.
Consistency over accuracy
The GFC’s major scientific contribution is providing a globally consistent methodology that eliminates the inconsistencies of combining disparate national datasets. While local, high-quality national maps may have higher accuracy in their specific region, the GFC offers the same processing everywhere, making it the perfect benchmark. As the Sentinel program continues to provide high-quality, cloud-free imagery from Sentinel-2, we can expect datasets like GFC to improve their temporal accuracy in the coming years.
With such consistency, however, come some challenges with accuracy. Forest loss is not identical everywhere, so while consistency is an advantage, it also means it is not fine-tuned to local conditions, especially when trying to estimate forest degradation rather than clear-cut loss. One example of this is in Ghana, where significant deforestation is driven by the expansion of cocoa farming. Cocoa is typically a shade-loving plant, so when a forest is cleared for cocoa, it is often the case that a significant portion of the upper canopy is left intact. This makes it very difficult to spot from satellite imagery. Likewise, in the Cerrado of Brazil, trying to find the forest change patterns within the complex mix of vegetation types across the landscape is very difficult. Often, the Landsat data being used in a non-optimised processing chain is unlikely to fully characterise the forest change accurately.
Our recommendation when using this data in Earth Blox is to contextualise it within the specific local conditions that are being monitored, and make direct local comparisons between the Hansen data and other datasets to inform your understanding of what is going on on the ground. This might include the ESA forest biomass map, or the use of Dynamic World (although recognising that this is only available from 2015). Even simply eyeballing the satellite basemap can add useful insights into the nature of changes on the ground.
A time series showing forest cover loss in the Amazon.
Use Hansen Global Forest Change data in Earth Blox
The Hansen Global Forest Change dataset is available in Earth Blox and integrated into the following templates:
Estimate forest cover from deforestation data: Quantify existing forest cover using the most recent year, applying a canopy cover filter based on your country’s forest definition.
Check forest loss matches reported figures: Monitor forest change during carbon project reporting periods.
The dataset can be added to your workflow in Earth Blox to support ARR project assessments, particularly for:
Eligibility screening: Assess whether areas were forested within the past 10 years, based on historical loss data.
Leakage monitoring: Identify forest loss in project buffer zones to evaluate potential displacement effects.
Suggested alternatives
Dynamic World Landcover (10m): AI-powered coverage of the Earth’s Surface by type (water, trees, crops etc.). Suitable for detailed land cover mapping and change over time.
ESA Above Ground Biomass (100m): Forest above-ground biomass estimates for years 2007, 2010, 2015, 2016, 2017, 2018, 2019, 2020, 2021 and 2022 with global coverage.
Chloris Geospatial Aboveground Biomass Stock and Change (10m) (Paid access): Annual data on aboveground biomass, carbon stock and carbon change since the year 2017. At 10m resolution and with quantified uncertainty for every pixel. You can see a sample data layer from Chloris over Paraquay in Earth Blox.
Biomass Carbon Density Maps 2010 (300m): Provides global baseline estimates of above and below-ground biomass for the year 2010.
Iain is a Professor of Applied Earth Observation at Edinburgh University, specialising in active remote sensing. He has over 27 years experience in academia and industry, 100+ publications, and advises UK government agencies on EO strategy.