Earth Blox dataset review: MapBiomas Brazil Collection 10
The MapBiomas land use and land cover classification dataset are the most consistent and comprehensive annual maps of Brazil of the last 40 years. Iain Woodhouse explores why this dataset is essential for Earth Blox customers working on nature-based solutions and regulatory compliance.
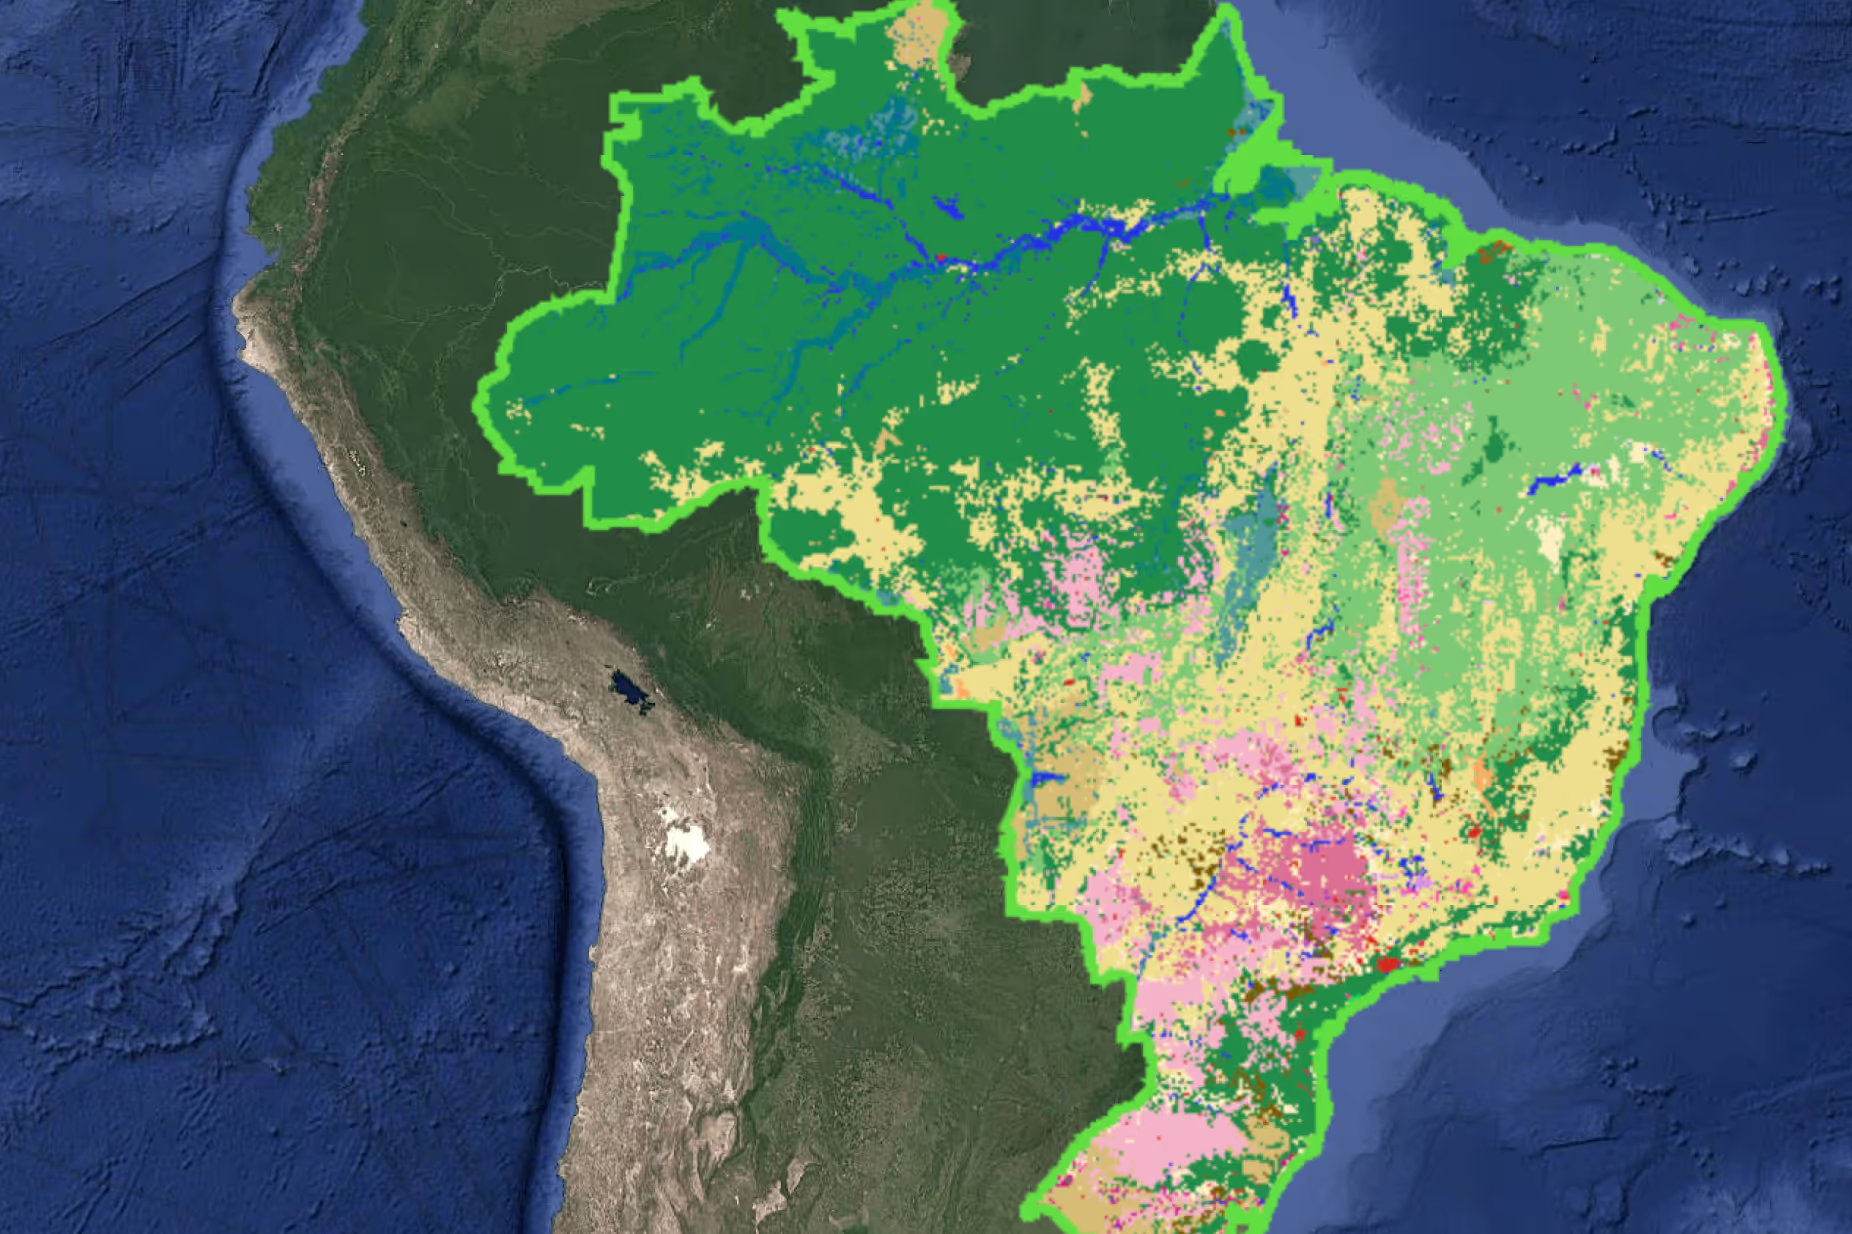
MapBiomas is a multi-institutional initiative involving NGOs, universities, and technology companies that maps land cover and land use changes in Brazil. Unlike official government datasets that often focus solely on deforestation, MapBiomas reconstructs the entire history of the landscape, covering forests, pastures, agriculture, water, and urban areas, on an annual basis.
The latest release, Collection 10, covers a remarkable 40-year period from 1985 to 2024. It utilises the entire Landsat satellite archive and machine learning algorithms on Google Earth Engine to distinguish between 37 different land cover classes.
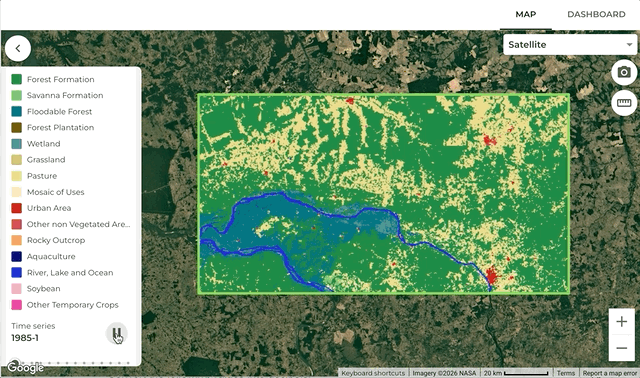
An animated GIF showing a time series of the MapBiomas product in the Earth Blox platform from 1985 to 2024 over the Cerrado. The landcover changes are very apparent. Note that all 37 classes do not appear in the legend as only 15 of them appear in this area.
Earth Blox verdict
MapBiomas is one of the most comprehensive historical land cover datasets available for any individual country in the world. For Earth Blox users, its value lies in its depth: it doesn't just tell you what is there now, but what was there every year for the last four decades.
This makes it the critical tool for the financial services sector. By overlaying this historical data with asset locations, banks and investors can assess "nature in agriculture", verifying if a property has a history of illegal deforestation or if a funded pasture is degrading in quality. It remains vital for carbon baselines and regulatory compliance, but its capacity to audit rural credit portfolios against environmental liabilities is a standout feature.
Pros:
✅ Unrivalled history: Continuous annual data from 1985 to 2024 allows for deep historical analysis of national land use change.
✅ Thematic richness: Distinguishes between 37 classes, including specific crop types (soy, sugarcane), pasture quality, and secondary vegetation stages.
✅ Open science: The methodology is transparent, peer-reviewed, and constantly refined by a network of experts in the specific Brazilian biomes.
✅ EUDR ready: The historical data allows users to explicitly verify land use status before and after the December 31, 2020 cutoff date.
Cons:
❌ Resolution: At 30m (Landsat), it may miss small-scale degradation or narrow riparian features detectable by 10m Sentinel-2 or 3m commercial data.
❌ "Alternation" noise: Pixel-based classification can result in "flickering" (e.g., Forest -> Pasture -> Forest), which may overestimate annual change rates if not accounted for correctly.
❌ Complexity: The sheer volume of classes and layers can be overwhelming for new users compared to binary "Forest/Non-Forest" maps.
❌ Processing lag: Annual collections are typically released in the second half of the following year (e.g., 2024 data in August 2025).
Technical specs
Ground sample distance (pixel size): 30m (based on Landsat). The 10m Beta version (Sentinel-2) is available on Earth Blox for 2016-2023 on request.
Coverage: Entire territory of Brazil (with sister projects in other Amazonian and Chaco countries, again, available on request for Earth Blox users).
Metrics: Annual Land Use/Land Cover (37 classes).
Frequency: Annual (historical series updated yearly).
Time Range: 1985 – 2024 (Collection 10).
Expert review
What is the dataset?
MapBiomas is not a single map but a living database. The vision for this product is focused on a shift from centralised government mapping to a "networked intelligence" model. Instead of one agency mapping the whole country, MapBiomas uses local experts for each biome. For example, Imazon maps the Amazon, SOS Mata Atlântica maps the Atlantic Forest, and so on.
They process petabytes of Landsat imagery using Google Earth Engine. A key feature is iterative reprocessing: every time they release a new Collection, they reanalyse the entire archive back to 1985. This ensures that any change you see is a real change in the landscape, not just a change in the algorithm.
What kind of data will we get?
You get a semantic history of every pixel with a high level of granularity on the classes. Whereas the ESRI landcover is only 9 classes, and the ESA Worldcover is 11 classes, MapBiomas brings 37 classes with a specificity designed around the biomes of Brazil.
How does the data perform?
The global accuracy for Collection 10 is reported at approximately91.5% for Level 1 classes (Forest, Farming, Non-Vegetated).
However, users must be aware of the "Alternation" effect. A recent study by Matos et al. (2025) noted that MapBiomas can exhibit more annual class transitions ("flickering") than reference datasets. This is a side effect of pixel-based machine learning. For Earth Blox users, this means you should be cautious about calculating deforestation rates by simply subtracting one year's map from the next, but instead, look at the longer-term trends.
What level of detail does it detect?
The 30m resolution is the standard for long-term land use change monitoring. It is excellent for identifying landscape-scale changes, farm-level conversions, and verifying supply chains for large commodities like soy and beef.
It is not designed for counting individual trees or monitoring small-scale selective logging . For users requiring higher precision for recent years, MapBiomas has released a 10m Beta Collection based on Sentinel-2 (2016-2023), which is better at resolving narrow features like riparian buffer zones. If you would like access to this data within Earth Blox, please contact us.
Similar products
PRODES (INPE): The official Brazilian government deforestation data. It is highly accurate but only maps clear-cut deforestation in primary forests and has a larger minimum mapping unit (6.25 ha) compared to MapBiomas (~0.5 ha).
TerraClass (EMBRAPA): Maps land use in deforested areas (e.g., pasture vs. agriculture) but is released less frequently than MapBiomas.
Suggested alternatives in Earth Blox
Hansen Global Forest Change: Good for global consistency, but strictly measures "Tree Cover Loss," often confusing harvest cycles or fire with deforestation. MapBiomas provides the "why" (land use class) that Hansen lacks.
ESA WorldCover (10m): Higher resolution (10m) but only available for specific years (2020, 2021). Better for a high-res snapshot, but it cannot provide the 40-year history needed for baselines.
Dynamic World (10m): Near real-time (weekly) land cover. Excellent for spotting immediate changes, but less rigorous than the annually validated MapBiomas collections.
Iain is a Professor of Applied Earth Observation at Edinburgh University, specialising in active remote sensing. He has over 27 years experience in academia and industry, 100+ publications, and advises UK government agencies on EO strategy.