Mapping the future of water: An open dataset for climate-resilient decisions
Water risk is becoming a defining challenge for businesses, investors and governments. This new open dataset brings leading climate and hydrological science into an accessible format, helping decision-makers understand how water availability may change across the globe under different climate futures.
Water is where climate change becomes tangible. Long before sea levels redraw a coastline, shifts in rainfall, runoff, and groundwater quietly reshape what a farm can grow, what a factory can rely on, and what a city can promise its residents. Yet for most organisations, the science describing these shifts has remained locked away in formats and tools that only a handful of specialists can use. Information about future water resources has simply not been easily accessible to the teams working on mitigation or adaptation strategies.
Today we're changing that. Earth Blox has published a new open dataset — Climate Change Impact on Water Resources — designed to put rigorous, forward-looking water science directly into the hands of the people making real decisions.
Access the Climate Change Impact on Water Resources dataset on Earth Blox and Source Cooperative
Median change in yearly Total Runoff expected by 2071-2100 compared to 1985-2014 under SSP 5.
Now available in Earth Blox
The dataset is ready to explore and analyse on Earth Blox, where it can be combined with 200+ nature and climate datasets, including land cover, biodiversity, flood hazard, human footprint, and more. That means you can move from a single water layer to a complete picture of how a place is changing, without writing a line of code.
Released openly on Source Cooperative
For teams who want to work with the raw numbers, we've also published the full dataset as an analysis-ready Zarr store on Source Cooperative. It's open, cloud-native, and ready to drop straight into a Python workflow. Access it here.
US$225 billion is already at risk
Water is often treated as an infinite, low-cost commodity, but the financial reality is shifting rapidly. For financial institutions, water security has graduated from a corporate social responsibility (CSR) footnote to a core strategic risk.
The numbers are stark. According to a report by Planet Tracker and CDP, listed companies have reported that US$225 billion in potential value is at risk due to water insecurity. This is not a theoretical future problem; it is stranding assets today. We are seeing major capital projects — from the US$8 billion Pascua-Lama gold mine on the Chile–Argentina border to the Keystone XL pipeline — become stranded assets in part due to water-related environmental opposition and regulatory hurdles.
The risk is not limited to heavy industry. As highlighted by McCauley in The Conversation, the rapid expansion of the digital economy is creating new pressure points. Data centres, the backbone of our AI revolution, consume massive amounts of water for cooling — often in water-stressed regions — yet companies rarely disclose the full extent of this consumption. This creates a hidden "blind spot" in tech portfolios where local water stress could lead to operational caps or reputational backlash.
Furthermore, the funding gap to solve these issues is immense. A BCG white paper analysing the water crisis in Texas notes that despite a historic US$20 billion state commitment, there remains a US$140 billion funding gap to secure the state's water infrastructure through 2070. This gap represents both a risk (unmitigated scarcity) and an opportunity for "catalytic capital" to step in.
This connection between water, nature, and financial risk is increasingly well-documented. The De Nederlandsche Bank (DNB) Working Paper No. 857, From Nature Shocks to Financial Stability, for example, traces how nature- and water-related risks propagate into the financial system, reinforcing the need for organisations to have credible, location-specific information about how water availability may evolve. For banks, insurers, and asset managers, the message is clear: past water availability is no longer a predictor of future supply. To avoid default risks and identify resilient investments, institutions need forward-looking data that accounts for climate change scenarios.
Encapsulating the state of the art in climate models
The hardest thing about planning for climate change is that there is no single "future" to plan for. The honest answer to "how will water change here?" is a range of plausible outcomes, shaped by how much the world warms and by the variability of the climate system and models.
This dataset is built to embrace that uncertainty rather than hide it. Instead of relying on one model's best guess, it draws on a multi-model ensemble — many independent scientific models run side by side. Where the models agree, you can act with confidence. Where they diverge, you can see exactly how much room for uncertainty there is, and plan accordingly.
It does this across two simple dimensions:
Emissions scenarios — from a world that rapidly cuts emissions to one that keeps burning fossil fuels, so you can stress-test your plans against optimistic *and* pessimistic futures.
Time horizons — near-term (around 2030), mid-century (around 2055), and end-of-century (around 2085) — so you can match the data to the lifespan of an asset, a strategy, or an investment.
For every location on a global grid, it describes how three key parts of the water cycle are expected to change relative to a recent historical baseline (1985–2014): total water availability, groundwater recharge, and evapotranspiration — the water returned to the atmosphere by soils and plants. Earth Blox processed this vast archive into a single, consistent, analysis-ready dataset so you can go straight to the insight.
Seeing it in action
Understanding a whole region at a glance. The map below (Fig. 1) shows the ensemble-median change in total water availability across Europe toward the end of the century, under a high-emissions scenario. Note that this map represents the median change pixel-by-pixel across the ensemble, rather than the median model in the absolute. Reading the central tendency this way, a clear north–south contrast emerges: a tendency toward wetter conditions across northern Europe (blue) — Scandinavia, the Baltic, and northwestern coasts — and toward drier conditions across the Mediterranean and southern Europe (red), from Iberia to the Balkans.
Fig. 1 Median change in yearly Total Runoff expected by 2071-2100 compared to 1985-2014 under SSP 5
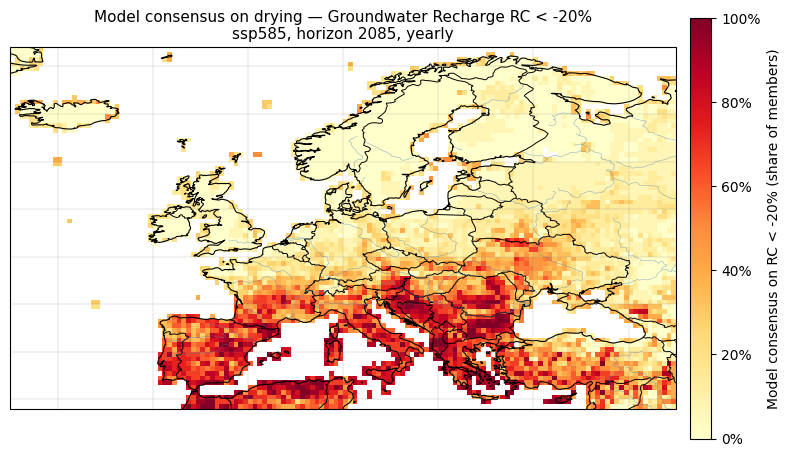
From "where" to "how sure are we?" A median map shows the central signal, but a decision-maker really wants to know how strongly the models agree. So we can ask a simple question: how many models point to something worse than a given level of stress? The map below (Fig. 2) answers exactly that for groundwater recharge, counting — for every location — the share of models that project a drop of more than 20% by the end of the century. Where the map turns deep red, almost every model agrees on serious drying; where it stays pale, the models see little cause for concern. The signal is striking: across Iberia, southern France, Italy, and the Balkans, a large majority of models converge on a ≥20% loss of recharge — turning a fuzzy "it might get drier" into a high-confidence warning.
Fig. 2 Percentage of models simulating a change in yearly Groundwater Recharge below -20% by 2071-2100 compared to 1985-2014 under SSP 5.
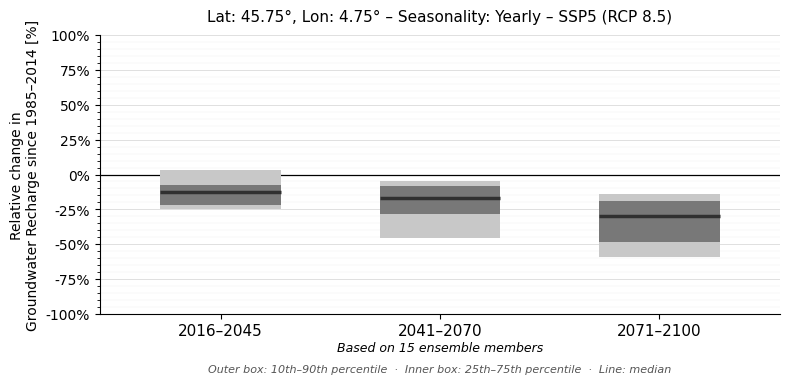
Zooming in on a single place — and its uncertainty. For a specific site, the Local Insights view (Fig. 3) tells a richer story. The chart below shows the projected change in groundwater recharge at a location near Lyon (France) across three time horizons. Each box captures the spread of the ensemble — the likely range, the more confident inner range, and the median. This is what makes risk-aware planning possible: rather than betting on the average, a cautious decision-maker can plan against the lower end of the range (for instance, the 10th percentile), building in resilience to a plausibly drier future.
Fig. 3 Local distributions of models depicting the potential relative change of the variable to the reference period (1985-2014). The interval between 10th and 90th percentiles is represented in light grey. The interval between 25th and 75th percentiles is represented in a dark grey with the median line inside.
Get started
Whether you're assessing the resilience of physical assets, reporting on nature-related risk, or simply trying to understand what a changing climate means for water in the places you care about, this dataset is built to help.
Use it in Earth Blox — Contact us to start exploring the data and combining it with our full catalogue of nature and climate layers.
Work with the open data — find the Zarr dataset and a step-by-step tutorial on Source Cooperative
The future of water doesn't have to be a black box. Let's make it actionable.
Guillaume is a geoscientist specialising in Earth observation, climate risk, and environmental modelling. He holds a doctorate in Environmental Science and is a Google Earth Engine Developer Expert, with experience spanning academia, consulting, and the reinsurance sector.